Search the Community
Showing results for tags 'gaymarriage'.
Found 1 result
-
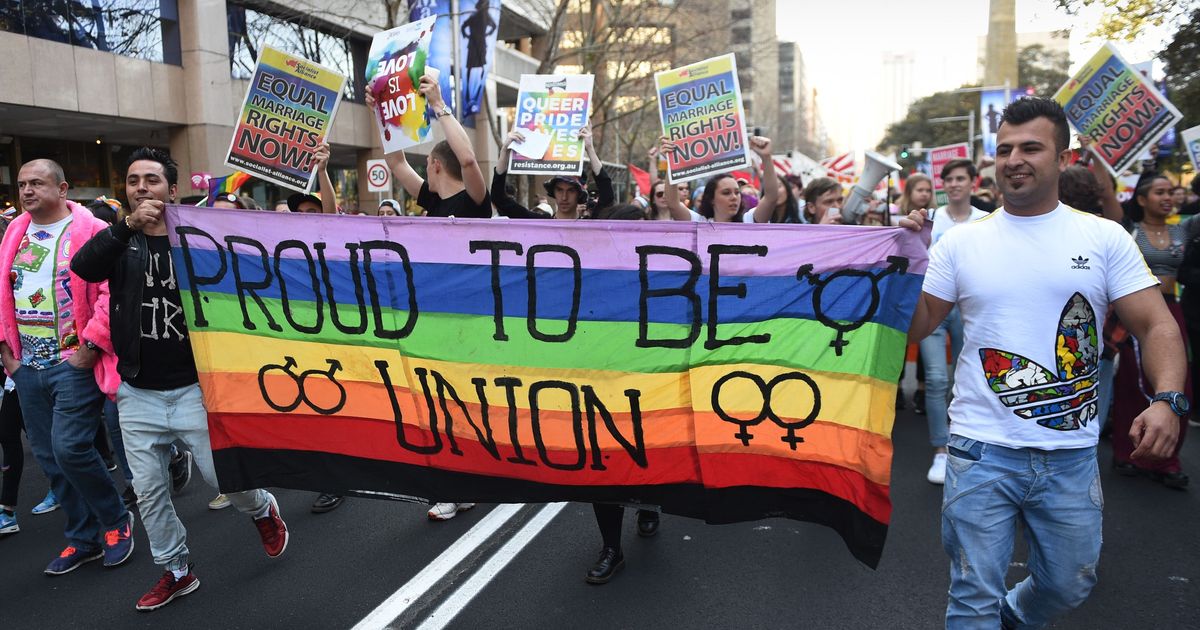
ONE statistic that has surprised many Australians in the same-sex marriage vote is that New South Wales had the most marginal Yes vote of any state. Just 57.8 per cent (2,374,362 people) voted Yes, with a significant 42.2 per cent (1,736,838 people) voting No. Every other state was above 60 per cent Yes, with the Australian Capital Territory top at 74 per cent, and Victoria close behind, on 64.9 per cent. The ACT has a small voting population, with 175,459 ticking Yes and 61,520 No, but you might have expected NSW and Victoria to be comparably progressive. In fact, NSW’s metropolitan electorates were some of the highest Yes voting seats in the country, with Sydney tying with Melbourne for the nation’s most strongly in favour, at 83.7 per cent. Even rural seats in western NSW were relatively strongly skewed to Yes. It was seats in south-west Sydney, many of which have large socially conservative immigrant populations, that were most likely to vote No. Out of 150 Federal Electoral Divisions, 133 recorded a majority Yes response, and just 17 divisions recorded a majority No response. Congrats Aussies, Read more here